
Using Vector Graphic Parameters to Enhance Map Symbols and Improve Workflow
Creating custom SVG map symbols requires a quick manual code adjustment after exporting your vector artwork. While Inkscape is excellent for drawing paths, it embeds presentation styles natively. To make a symbol dynamic so QGIS can directly modify things like fill color, outline color, and opacity, you must swap these static style tags with dynamic QGIS parameter functions.
Here is a step-by-step guide to building custom, data-definable map markers.
Step 1: Design the Symbol in Inkscape
I won’t go into the details on how to draw or design your SVG vector file in Inkscape. There are plenty of tutorials to be found online for that. Instead, I will offer some useful tips:
- Keep your vector paths clean and simple to ensure smooth rendering inside QGIS.
- Set the Document Canvas: Open Inkscape, go to File > Document Properties, and change the display units to pixels (
px). Set the canvas width and height. It doesn’t need to be square (e.g.,32x32 pxor64x64 px), but it can make things easier when plotting on the map. - Center your drawing: Ensure the object sits directly in the center of the canvas so the anchor point aligns properly on your map.
- Remove Extra Layers: Grouping objects is fine, but avoid excessive nested layer structures.
- Name your Vector Objects: Use something unique and identifiable so you can find where to insert parameter code into the SVG file later.
- Export as Plain SVG: Go to File > Save As…, type your file name, and change the file format dropdown from Inkscape SVG to Plain SVG (*.svg). This is not entirely necessary, but it removes a lot of extra Inkscape-specific metadata.

Step 2: Inject QGIS Parameters into the SVG Code
QGIS parses SVG nodes for specific param() attributes. It cannot read these if they are buried inside a standard style="..." string.
- Open your exported Plain SVG file using a plain text code editor like Notepad++, VS Code, or TextEdit.
- Locate the vector path element, which typically begins with
<pathor<polygon. If you named your objects in Inkscape, you can search for the “id= ” tag with the name of your object. - Insert distinct XML attributes using the
param()placeholder format. I provide a table of different options below. - It’s important that the param() placeholder is inserted within the <path or <polygon tag (meaning between the < opener and /> closer symbols. See the example photo). Otherwise the the parameters won’t take effect.
- Save the changes and close the text editor.

| Parameter | Effect |
| fill=”param(fill)” | Changes the fill color of the object |
| stroke=”param(outline)” | Changes the outline (stroke) color of the object |
| opacity=”param(fill-opacity)” | Changes the fill opacity of the object |
| stroke-opacity=”param(outline-opacity)” | Changes to outline (stroke) opacity of the object |
Step 3: Link Your Custom Folder to QGIS
Before loading the symbol, you should tell QGIS where your custom graphics library lives. I’ve outlined this process in a previous post on how to dynamically place multiple custom symbols on a map using attribute data.
Step 4: Apply and Style Your Symbol
Now you can utilize your custom marker just like any default QGIS asset.
- Click the Symbology tab in the layer Properties window, or use the Layer Styling panel.
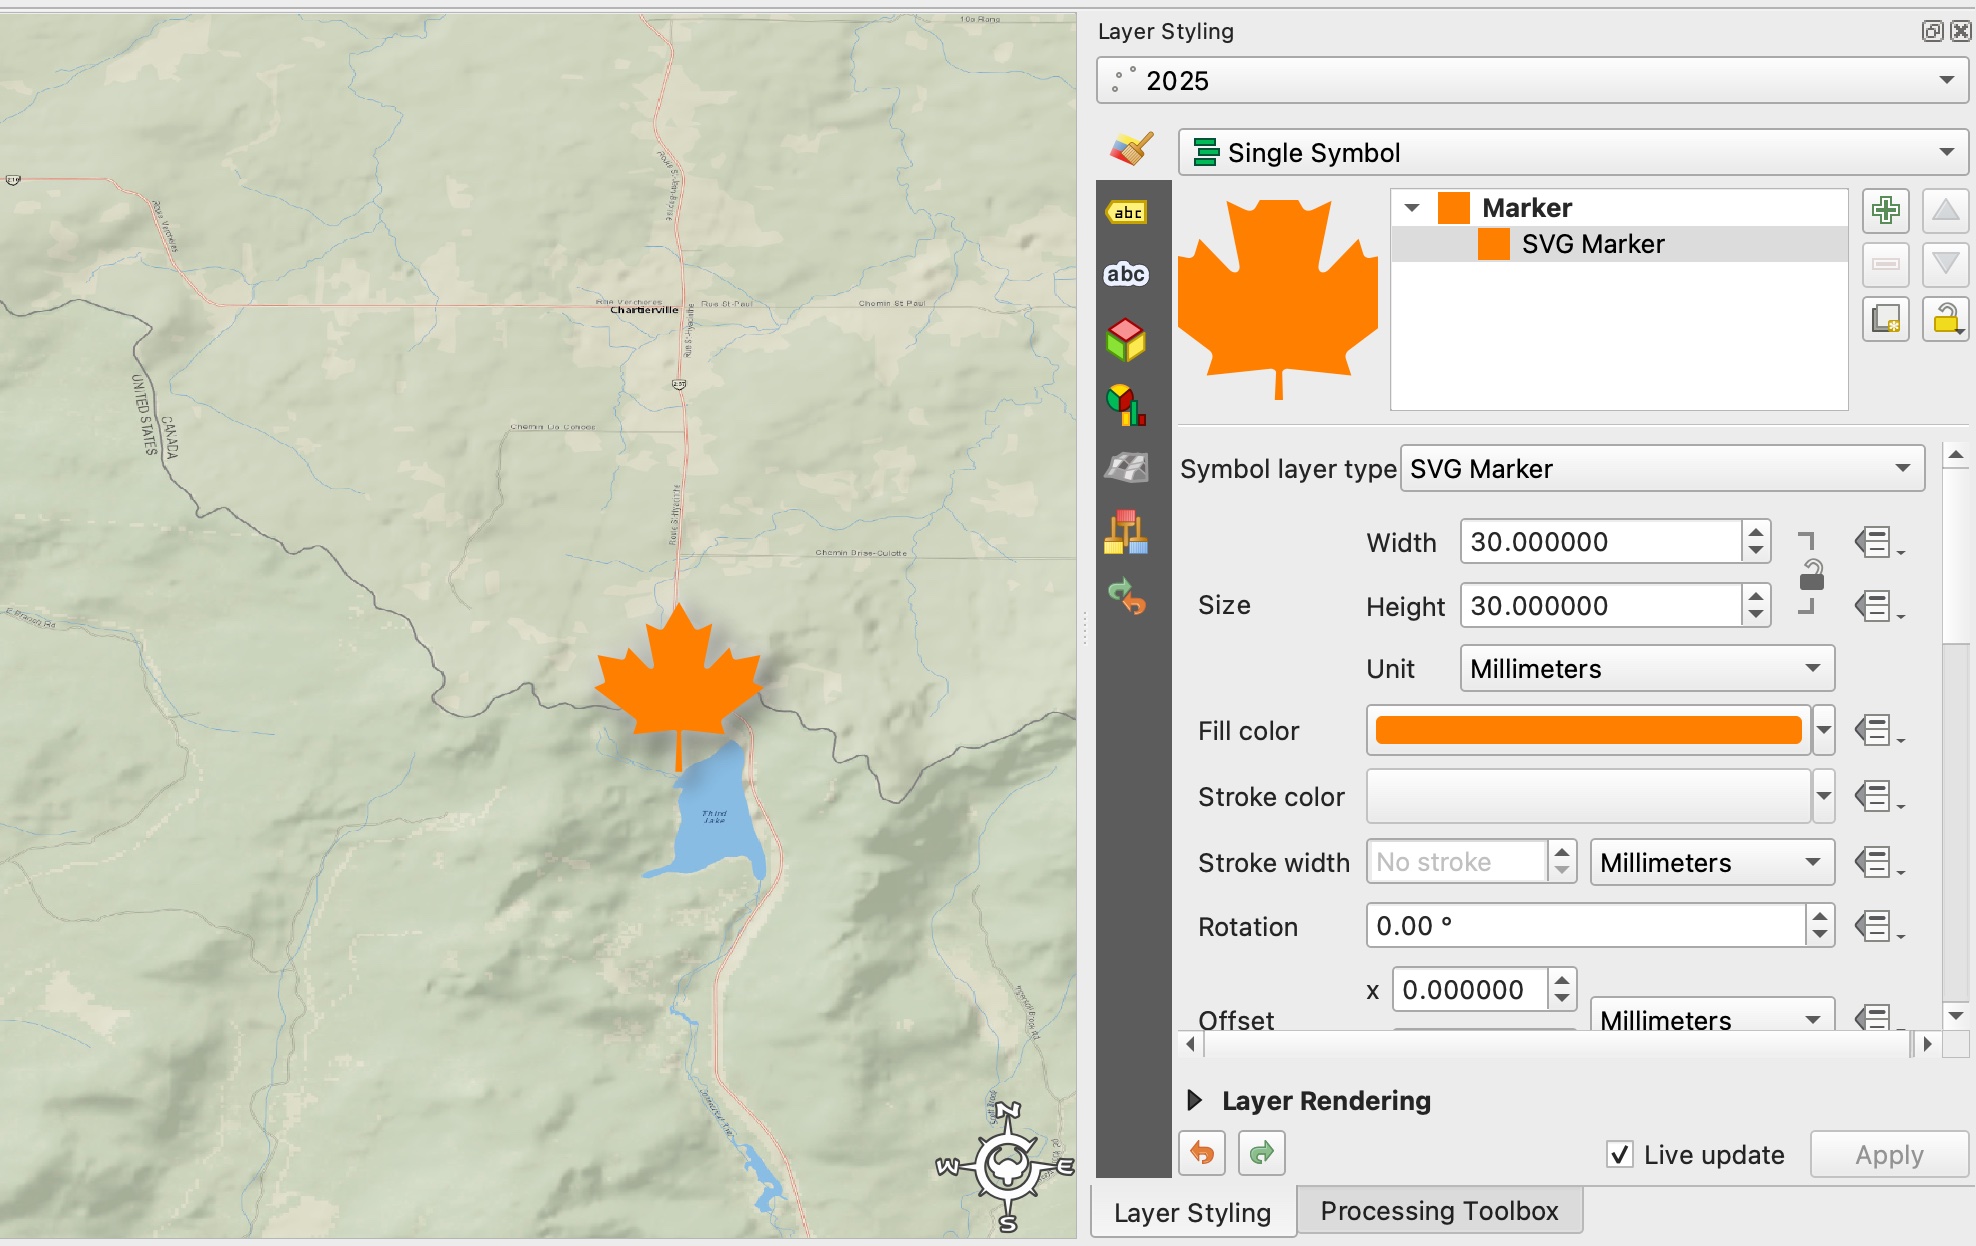
- Highlight the child symbol tier (usually labeled Simple Marker) and change the Symbol layer type drop-down to SVG Marker.
- Locate and select your custom symbol.
- Adjust the marker properties. Depending on the param placeholders you inserted into the SVG file, you will notice the Fill color, Stroke color, and Stroke parameters are editable.

The fun part is, you can mix and match the param placeholders in the SVG file to allow adjusting the different symbol parameters. Say you want to adjust the colors of two separate objects in your symbol, well all you have to do is set the fill parameters in the SVG file to the two different QGIS color options. Just remember to name each separate object in Inkscape before saving the SVG, and insert param placeholders into the file similar to this:
- Object #1: fill=”param(fill)”
- Object #2: fill=”param(outline)”
Now you can change two colors on one symbol using the same process!
QGIS also allows dynamic overide of the colors with a very similar process and only a couple extra steps, but I will save that saga for another post!
Until next time, keep exploring the world around you!